.

.
marylin monroe
Showing posts with label metabolic syndrome. Show all posts

Fat Loss Principles That Work: 10g+ of EAAs W/ Every Meal. Do Energetic Costs of Protein Synthesis Trigger This Effect?

EAAs beyond whey: It may not necessarily look like this, but this salad (repicecorner) is an EAA power horse with cheddar cheese (25% protein, 0.49 EAA / P ratio), tuna (in oil, 29%,  0.45) and kidney beans (9%, 0.45). You see, it does not always have to be chicken breasts or whey to get beyond the 10g+ EAA threshold, I have repeatedly suggested as one of the fundamental rules of dieting for weight loss, maintenance and muscle gain.
Many people take it for granted that you become fat, when you get old. If you look at the statistics, you could even make a point that obesity has some protective effects with esp. with respect to CVD mortality. Scientists call this the "obesity paradox" (Kastorini. 2012). What's particularly paradox, at least in my humble opinion, is yet not the phenomenon itself, but rather the fact that it gets smart scientists derailed from working on useful dietary and exercise interventions to prevent the development of heart disease, cancer, metabolic syndrome etc. in early years. Instead, they argue ex-post, i.e. when the baby has already been thrown out with the bathtub by comparing sick lean (in parts even cachectic) and sick "obese" people, why their statistical shenanigan that's based on the useless BMI produces paradoxical results. And that, when studies such as the one Jacobs et al. did in 2010 clearly show that 50+ year old men and women with waist circumference >120cm and >110cm, respectively, have 2x higher all-cause mortality risk than their lean peers - irrespective of BMI (Jacobs. 2010)!

To get lean and stay lean, yet not thin and skinny fat is therefore a challenge everyone...

... from the child in the Kindergarten to the obese granny in the nursing home is facing. Against that background a previous study by Loenneke et al. comes to mind. The results of their analysis, which were published in Nutrition and Metabolism in January 2012 clearly show that the amount of times people eat meals with a 10g+ EAA content per day was inversely related to percent central abdominal fat (Loenneke. 2012). In previous studies EAAs have also been shown to improve glucose clearance without increases in insulin and in the absence of effects on the fat burnin and health promoting expresion of AMPK-alpha2 in skeletal muscle tissue (see "EAAs Stimulate Muscle Glucose Uptake by Exponentiating Insulin's Effect on GLUT4 Expression"). With the advanced publication of a study by Coker, Miller, Schutzler, Deutz and Wolfe in the online verison of the Nutrition Journal a couple of days ago, the notion that EAAs have a particularly beneficial effect on fat loss - in this case in obese elderly individuals - gets further support from a well-controlled randomized trial (Cooker. 2012).

EAA-rich protein increases fat loss to a greater extent than low EAA protein

The researchers from the Center for Translational Research in Aging and Longevity and the University of Arkansas for Medical Sciences in Little Rock, AR, USA randomized 12 elderly individuals (mean age 69 years) to an 8 week, caloric restriction diet utilizing equivalent caloric meal replacements (~850 kcal/day; the exact nutrient composition can be found in figure 1) + ~400kcal from solid foods (total intake: ~1,250kcal/day; the subjects were free to chose their solid meals but were provided with a list of examples the should pick from, if possible).
Figure 1: Macronutrient composition of the meal replacements used in the study (Cooker. 2012)
The diet was designed to induce a 7% weight loss in two months. And while both,  the rate of weight loss (~1.6lbs per week), as well as the relatively high caloric deficit are certainly appropriate for someone with a 30+ BMI and ~40% body fat, leaner people will fare better with a less pronounced kcal deficit or (alternatively) have to add some strategically planned refeeds to the equation in order to minimize the loss of lean mass and, more importantly, avoid the ensuing reduction in energy expenditure (for the obese, the latter is actually less of the problem, because the downsides of being calorically deprived are at least partly counglucose tolerance and leptin sensitivity with every gram of body can actually help the body recognize that there is still plenty of energy that has just not been available (glucose) or "visible" (fat) before).
Figure 2: Changes in lean and fat mass (kg, left) and fractional protein synthesis rates (FSR) in participants receiving iso-caloric meal replacements with identical macronutrient compositions (see figure 1), but different amounts of essential amino acids (EAAs) content (Coker. 2012)
As the data in figure 2 goes to show you even the obese individuals in the study at hand lost a non-negligible amount of lean mass - unfortunately the body composition was measure with a sophisticated, but still body impedance based device, the trends are still accurate, but it is questionable in how much we are actually talking about ~2 and 2.5kg of muscle mass (figure 2, left), because somebody's "lean body mass" does obviously include more than just skeletal muscle.

When it comes to supplements, we are often like children on Christmas eve. About all the new stuff we get we tend to forget our former favorite and often way more fun to play with toys. Don't make this mistake and ditch your PWO whey (personally, I like a ~1.5:1 whey + micellar casein mixture) for EAAs, they don't come close... read more
Be that as it may - since the before and after values were taken with the same device the changes should be correct, so that both the slightly yet not statistically significantly ameliorated loss of lean body mass and, more importantly, the significantly higher degree of body fat loss in the EAA meal replacement (EAAMR) group speak in favor of the 5 servings of a the 170 kcal, 6g EAA per day. Moreover, "the sparing influence of muscle loss might have been demonstrated with a larger sample size", so that you can take it for granted that the preservation of precious muscle mass is an advantage of being choosy with your protein sources and preferring those with higher over those with lower essential amino acid contents.

On a related note: I don't know if you noticed, but with a total energy content of 850kcal and 30g EAA these 5 meal replacements did in fact have exactly those 10g+ of essential amino acids, I have repeatedly recommended to have with each of the 3 meals most people consume in the course of the day.

In all fairness, it should also be mentioned that despite not being significantly different at baseline, the body fat percentage of the subjects in the EAA meal replacement group was ~3% higher to begin with.This may seem irrelevant, since figure 2 compares lean mass and fat mass as absolute changes and not their percentages, but in the end, the amount of fat you you can drop within a given time-frame decreases with lower body fat percentages.

Do the energetic costs of protein synthesis drive fat loss?

Another interesting observation Coker et al. made is the close association between fat loss, on the one hand, and increased protein synthesis (55%), on the other hand. The researchers take this as an incentive to do one of the of the much loved calories in vs. calories out calculation and come up with the following hypothesis:
"Acute administration of EAAMR did promote a significant increase in skeletal muscle protein FSR compared to CMR. Assuming that the energy cost of protein synthesis is 3.6 kJ/g and the baseline GAIA-derived lean tissue mass was 56.4 kg for EAAMR and 54.4 kg for the CMR, we can extrapolate that the overall energy discrepancy between the two groups was roughly equivalent to 27,170 kcal or 3.5 kg of weight loss across the entire caloric restriction-based weight loss paradigm. Based on the amount of total lean mass in each group, this value takes into account a consistent intervention structure of five servings/day across an eight week period. In short, these calculations suggest that differences in the source of intact protein/formulation of EAA may have a significant influence on diet-induced energy expenditure that coincides closely with the greater reduction of adipose tissue in EAAMR compared to CMR." (my emphasis in Coker. 2012)
I usually discard fallacious calculations like this one if they are not highlight the stupidity of trying to eat exactly as much as some funky formula + the figure on your treadmill, pedometer, heart rate monitor or whatever fancy tool you may use to "measure" your energy expenditure suggest you would have burned in the last 24h. In this case, however, I made an exception, because I feel that the notion that protein quality is one of the myriad of parameters that are missing from this foolish calculation is important, for lean and obese people from all age groups who are trying to shed body fat.

Bottom line: The take away message of the study is in the end identical to the previously mentioned study by Loenneke et al.: Make sure you hit the 10g EAA threshold with each and every of your meals, if being lean and muscular not skinny yet fat is your goal.

References:
  • Coker RH, Miller S, Schutlzer S, Deutz N, Wolfe RR. Whey protein and essential amino acids promote the reduction of adipose tissue and increased muscle protein synthesis during caloric restriction-induced weight loss in elderly, obese individuals. Nutr J. 2012 Dec 11;11(1):105. [Epub ahead of print]
  • Jacobs EJ, Newton CC, Wang Y, Patel AV, McCullough ML, Campbell PT, Thun MJ, Gapstur SM. Waist circumference and all-cause mortality in a large US cohort. Arch Intern Med. 2010 Aug 9;170(15):1293-301.
  • Kastorini CM, Panagiotakos DB. The obesity paradox: methodological considerations based on epidemiological and clinical evidence--new insights. Maturitas. 2012 Jul;72(3):220-4.
  • Loenneke JP, Wilson JM, Manninen AH, Wray ME, Barnes JT, Pujol TJ. Quality protein intake is inversely related with abdominal fat. Nutr Metab (Lond). 2012 Jan 27;9(1):5.

High Dietary Acid Load Doubles Risk of Type II Diabetes in Lean Individuals! Causative or Corollary? Plus: Are Grains, not Meats the Main Offenders in the Modern Diet?

If you go for green, you are usually on the save side of things... ah pHs ;-)
You will probably remember the association between higher acid levels (not even out of range), metabolic syndrome, lowered growth hormone release and a plethora of other ill-health effects I already hinted at in "How Could Bicarbonate Help You Lose Fat & Build Muscle" (read more). A new study from the Gustave Roussy Institute in France is now the first large scale study to provide relatively conclusive support for the hypothesis that there is a direct relationship between dietary acid load and the risk of cardiometabolic diseases and type II diabetes (Fagherazzi. 2013).

Credible evidence from large cohort

Fagherazzi et al. analyzed data from 66,486 women who were part of the E3N study (Etude Epidémiologique auprès des femmes de la Mutuelle Générale de l’Education Nationale), a French prospective cohort study of 98,995 female teachers, who were followed for incident diabetes over 14 years (the study started in 1999).
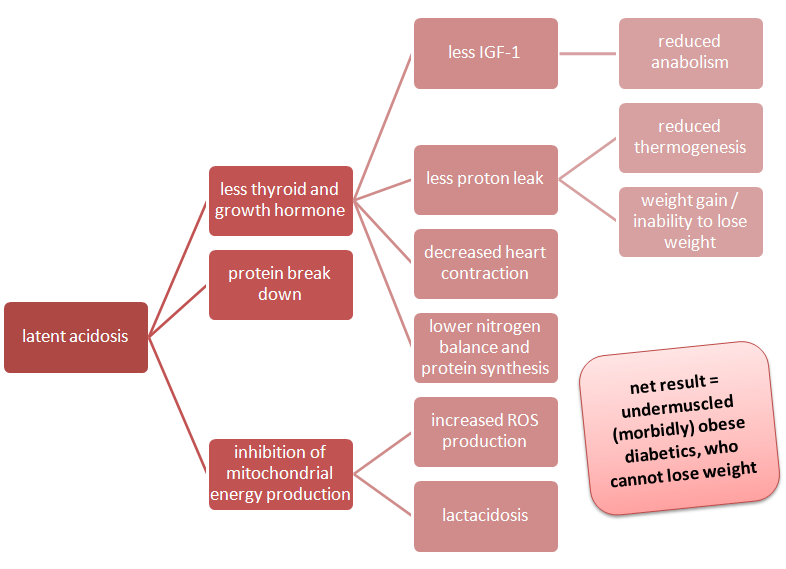
Latent Acidosis? Why do I care? As you can see in the image to the right, even latent acidosis can reduce thyroid hormone production, increase protein breakdown and inhibit mytochondrial function . The latter leads to increased ROS, lactate production & proton leak, while the former entails decreases in protein synthesis, IGF-1 & cardiac output. These changes have long thought to promote the development of the metabolic syndrome by increasing inflammation and reducing the basal metabolic rate (Berkemeyer. 2009).
During the 14-year follow-up period, a total of 1,372 cases of incident type 2 diabetes were validated. Fagherazzi et al.'s close analysis of the data revealed that there is a significant association between higher potential renal acid loads (PRALs) and the incidence of type 2 diabetes. Specifically, Fagharazzi et al. point out, ...
"[...] the highest PRAL quartile, reflecting a greater acid-forming potential, was associated with a significant increase in type 2 diabetes risk, compared with the first quartile (HR 1.56, 95% CI 1.29, 1.90)." (Fagherazzi. 2013)
A risk increase of 56%, alone, is a pretty impressive figure. What's even more impressive, though, is the fact that the association was significantly stronger among normal-weight women with a BMI <25 kg/m². For them the risk of developing type 2 diabetes almost doubles (+96%), when the dietary acid load is high. That's quite telling in view of the fact their baseline risk of developing T2D is low compared to those of the overweight study participants for whom the additional risk factor "dietary acid load" produced a significant (p = 0.03), but relatively low risk increase of only 28%.

The characteristics of the pro-diabetic diet

When we take a closer look at the actual data, there are dozens of statistically highly significant differences between the low and high pH quartiles (most of them with a p-value of p < 0.001). I initially tried to plot the differences, but that got way too chaotic, so I decided to make a list of items such as "higher energy intake (+15%)" indicating that the subjects with a high PRAL value (~the one's who were living on the more acidic side of the divide ;-) had a 15% higher energy intake than the subjects in the low PRAL quartile:
  • It may be coincidence, but in view of the anecdotal link between artificial sweeteners and heart-burn it's probably worth mentioning:  The most acidic study participants consumed 20% more artificially sweetened beverages (more about sweeteners)
    higher energy intake (+15%)
  • lower carbohydrate intake (-10%)
  • higher fat intake (+9%)
  • higher protein intake (+10%)
  • higher animal protein intake (+4%)*
  • lower fiber intake (-20%)
  • higher phosphorus intake (+16%)
  • lower potassium intake (-23%)
  • higher calcium intake (+10%)
  • lower magnesium intake (-22%)
  • higher sodium intake (+26%)
As a seasoned SuppVersity veteran, you will already have realized where this is heading: Higher energy intake, higher fat intake, hilariously low levels of potassium and magnesium, and salt intakes way beyond the 3g margin - all these are SAD (=standard American diet) hallmarks of the way the average Westerner (even in metropolitan France) eats. The 88% higher cheese intake, the 45% lower fruit + 25% lower veggie intake and 45% more of everyone's favorite "healthy" bread complete the picture that's emerging here: It's the Pizza Hut Diet ;-)

* The meat is not our only problem!

You will probably already have been wondering about the "*" and the fact that I highlighted higher animal protein intake (+4%)* in the previous list, right? Don't worry, I am not going to blame our problems on meat and suggest we all go vegan. The actual reason I highlighted the "bad" animal protein is a different one: the corresponding press release that came with the study (some of you may already have read it on Science Daily or other copy+paste 'science news portals'). It goes without saying that whoever wrote the short blurb used the study results for another sweeping blow at animal proteins by citing the following paragraph, and only but the following paragraph from the discussion of the results:
Suggested read: "Meat-Ology: The Link Between Red Meat, Cooking Techniques & Prostate Cancer" | more
"A diet rich in animal protein may favour net acid intake, while most fruits and vegetables form alkaline precursors that neutralise the acidity. Contrary to what is generally believed, most fruits such as peaches, apples, pears, bananas and even lemons and oranges actually reduce dietary acid load once the body has processed them. In our study, the fact that the association between both PRAL and NEAP scores and the risk of incident type 2 diabetes persisted after adjustment for dietary patterns, meat consumption and intake of fruit, vegetables, coffee and sweetened beverages suggests that dietary acids may play a specific role in promoting the development of type 2 diabetes, irrespective of the foods or drinks that provide the acidic or alkaline components."(Fagharazzi. 2013)
Obviously, it's going to be the first part of this paragraph, the one about the bad animal protein, that will get stuck in people's heads. The second part, the one that mentions rather casually that we are talking about total and not specific dietary acid loads, on the other hand, will go unnoticed. 

Figure 1: Food composition of paleo (top; estimation assumes a high meat intake) and modern US diet in % of total energy intake (Sebastian. 2013) - Don't forget: 1kg of lightly acidic foods are more acid forming than 100g of highly acidic foods!
Just as the fact that grains, which contribute an estimated 38% of the acid load yielded by the combined net acid-producing food groups in the contemporary diet (Sebastian. 2002), are just as, if not more problematic than the occasional steak of which the mainstream recommendations will tell you that you cannot have it more than once or twice a week, anyway.

'Paleo reasoning' to the rescue!?

In an effort to calculate the estimated net acid load of the 'ancestral', 'paleo' or 'whatever-you-want-to-call-it'-diet Sebastian et al. tested several scenarios, the worst of which a high protein, high fat version of the paleo diet (227g of protein, animal-fat content = 46%–63% of animal-food energy) still had a negative net endogenous acid production (NEAP = -7; Sebastian. 2013).

A low fat variety with a animal to plant food ratio of 35%:65% and an animal fat content of only 26% from animal-food energy and an even higher protein intake of 258g per day had a NEAP value of whopping -78. By "paleo standards" the average Westerner is thus consuming an extremely acidic diet, he is not genetically adapted to...  ;-)
Table 1: Acid-base value of common foods; positive values signify "acid forming", negative values "alkalizing" effects, the higher the figure the more pronounced the greater the impact of the given food is going to have (Cordain. 2012)
Paleo logic + scientific evidence = Win!  You all know that I don't buy the mainstream interpretation of the 'we are not adapted to...'-logic and the way it is employed by its followers in an almost religious way and against all scientific evidence.

What I do buy, however, are conclusions and recommendations that are based on both 'paleo logic' and scientific evidence - conclusions like the one Fagherazzi formulate in the last paragraph of their paper:
"[The] dietary acid load is directly associated with an increased risk of type 2 diabetes. From a public health perspective, dietary recommendations should not only incriminate specific food groups but also include recommendations on the overall quality of the diet, notably the need to maintain an adequate acid/base balance."
You want to know what foods Fagherazzi et al. may possibly be referring to? I already expected that. Just have a look at the table to the right, but don't forget: The study at hand does not prove causation. You could as well argue that it's the sum of dietary differences I listed as "characteristics of the pro-diabetic diet" which cause the diabetes. Anyways, the good news is: The solution, i.e. following a whole foods diet, is the same.

References:
  • Berkemeyer S. Acid-base balance and weight gain: are there crucial links via protein and organic acids in understanding obesity? Med Hypotheses. 2009 Sep;73(3):347-56.
  • Cordain L . AARP The Paleo Diet Revised: Lose Weight and Get Healthy by Eating the Foods You Were Designed to Eat. John Wiley & Sons, Apr 23, 2012
  • Sebastian A, Frassetto LA, Sellmeyer DE, Merriam RL, Morris RC Jr. Estimation of the net acid load of the diet of ancestral preagricultural Homo sapiens and their hominid ancestors. Am J Clin Nutr. 2002 Dec;76(6):1308-16.

A Higher Intake of CLA and Vaccenic Acid from Dairy, Beef, Veal and Lamp Could Prevent Subtle Weight Gain in Healthy Middle-Aged Individuals. Is 1.5g/day the Magic Number?

A dairy cow: Does her stomach hold the key to a leaner, healthier life or are CLA and vaccenic acid, the ruminant trans-fatty acids just as bad as their grainy cousins?
There are supplements that work and supplements that don't work and then there are those supplements, where nobody can actually tell, whether they belong to the former or the latter category. Conjugated linoleic acid, the ruminant omega-6 trans-fat you will find at particularly high concentrations in milk and meat products from grassfed dairy, unquestionably belongs to the latter category. While we do actually have plenty of in parts almost unsettlingly impressive rodent data (e.g. "CLA Destroys Body Fat & Increases Endurance! But at Which Costs?"), the outcomes of independent  controlled human studies are equivocal; with results ranging from "total failure", to "promising, but not half as impressive as we have expected based on previous rodent studies".

That being said, I was quite intrigued, when I hit onto a recently published study that takes a novel angle on the whole CLA for weight loss issue. One I usually don't like, as it involves a lot of statistical shenanigan, but still appears appropriate in this particular case, where the controlled small scale trials are failing us.

The Nordic Men (and women) love their full-fat dairy - rightly so?

If you are a loyal reader of the SuppVersity, who does not just read the detailed elaborations here on www.suppversity.com, but is also following the latest short news on the SuppVersity Facebook Wall, it probably won't surprise you that the study which is going to be published in the October issue of the European Journal of Clinical Nutrition has been conducted in Northern Europe. After all, you will have noticed that many of the interesting short news items relating to (larger scale) studies on the effects of one or another of the "bad fats" are conducted at universities and research centers in Sweden, Finland, Norway and, as in this case, Denmark - at the Aarhus University, to be precise, where Hansen and his colleagues datasets from the Diet, Cancer and Health study from December 1993 to May 1997. The participants, 160,725 men and women, aged 50–64 years, who were all born in Denmark and had been living in the greater Aarhus or Copenhagen areas, had all completed detailed food frequency questionnaire (FFQ) and a self-administered lifestyle questionnaire, before they underwent a physical examination and a follow up 5-6 years later.

How did the scientists know how much CLA and vaccinic acid the individual food items contained? unfortunately, they didn't. The way by which they calculated / estimated it,  i.e, by combining the content of r-TFAs in milk fat (data based on another Danish study) with the content of milk fat in dairy products given by the Danish food composition tables and using the values of r-TFA content in ruminant meat products representative of the supply in Denmark, does however make sense to me. The resulting averages should therefore be relatively reliable.
Based on the 77 food items of the food frequency questionnaires which contained ruminant trans-fatty acids R-TFA (this includes both CLA, as well as vaccinic acid which can be converted to CLA in the human body; cf. Turpeinen. 2002), i.e.
  • dairy products (n=63), 
  • ruminant meat products (beef, veal or lamb) (n=2), and
  • composite recipes containing both dairy and ruminant meat (n=12) 
Hansen et al. calculated the average r-TFA intake of each of the 57053 subjects with complete datasets and correlated them with the participants changes in body weight and waist circumference (WC) over the 5-year period to the follow-up.

A massive amount of data suggest minimal amounts of r-TFA are necessary

As the subheading to this paragraph already reveals, the result of the all this statistical shenanigan suggest that the ruminant trans-fatty acid intake from foods, not supplements, does have a beneficial effect on the change in total body weight (an ameliorating effect on weight gain, to be precise).
Figure 1: Absolute intake of ruminant R-TFA (in g/day) and changes in weight; adjustment for sex, age, height, baseline weight, smoking, alcohol intake, education, weighted intake of foods containing high amounts of I-TFA (g/day) and in women, menopausal status and hormone replacement therapy (Hansen. 2012).
A brief glance at the graphs in figure 1 will yet also tell you that their effect on body fatness (as indicated by changes in visceral adipose tissue), is negligible, not to say non-existent. In a way you may say that this is a good thing, because the turning point at a daily r-TFA intake of >1.5g/day, where the restricted cubic spline (that's a statistical fit into the data; figure 1, solid lines) seems to indicate that r-TFA intakes of more than 1.5g/day would precipitate weight gain, is thus absent as well.
Figure 2: Relative intake of R-TFA (in % of total energy intake) and changes in waist circumference. Solid lines: restricted cubic spline with five knots; Dashed lines: 95% confidence interval; same adjustments as in figure 1(Hansen. 2012)
In addition, if we do also consider total energy consumption and the contribution of r-TFAs to the latter (see figure 2), it becomes obvious that we cannot neglect the profound widening of the 95% confidence interval in figure 1 (dashed lines), which tells us that some of the high r-TFA consumers did get even leaner, while others did gain a significant amount of weight. Adjusted for caloric intake and the other confounding variables this effect vanishes and a trend towards lower / even no body weight gain in high r-TFA consumers becomes visible (even within the higher intakes, where the confidence interval widens, due to the lower number of participants, but does not change the general trend). The beneficial effect on waist circumference, however, remains negligible.

So what, if anything, can we learn from these results?

At first sight, the results of the study at hand seem to stand in line with what you have read in "Fat Advantage: 61% Lower Rates of Metabolic Syndrome in High Fat Dairy Lovers", here at the SuppVersity exactly one week ago. It even appears to provide a mechanism by which the high fat dairy products could exert their highly desirable anti-obesity effects, if the high CLA + vaccenic acid (r-TFAs) consumers in the Hansen study were not just the subjects who gained the least weight (measured against their nutrient intake and adjusted for all sort of other confounding factors), but also those with the lowest increase in visceral adipose tissue.  

If that were the case, however, the graph on the right hand side of figure 2 should have at least some kind of slope. Since it hasn't, we must assume that the beneficial health effects of r-TFAs are either (a) not brought about by changes in visceral obesity, (b) the latter are not appropriately quantified by simply measuring the waist circumference or (c) in view of the fact that we are not talking about "weight loss", but rather a prevention of the (partly probably age induced) increase in weight gain a stable waist circumference has to be considered a "success", already.

The scale is an unreliable tool to judge visceral obesity. And even a measuring tape can be misleading, if you are really "skinny fat".
Personally, I tend towards a combination of all three. First of all even moderate weight gain has been shown to increase the risk of impeding metabolic syndrome. The weight stability over >5years in the high r-TFA consumers must therefore be considered to be prognostic of a lower risk of metabolic syndrome. Secondly, visceral does not necessarily equal abdominal fat. Especially in older individuals the gynoid fat areas contribute to visceral obesity, as well. Moreover, we all know the skinny fats, men and women with a relatively large amount of highly inflammatory visceral fat and normal or even low waist circumferences also known as "normal weight obese"; cf. Romero-Corral. 2010).

And thirdly and most importantly: Weight loss is mainly an issue for people who are already overweight or obese. For best-agers who are still in form (and in Denmark there are such people ;-), success is better defined by maintaining the muscle mass you have, not accumulating additional (visceral) body fat and leading an overall healthy lifestyle. That ruminant trans-fatty acids can, maybe even should be a part of the dietary side of this healthy life-style is therefore the main take home message of this study.

What should not be forgotten, however, is the fact that this study was at least in parts supported by the Danish Dairy Research Foundation, certainly not an organization with a particular interest in "bad news" on vaccenic acid, conjugated linoleic acid and dairy products in general, right?


References:
  • Hansen CP, Berentzen TL, Halkjær J, Tjønneland A, Sørensen TI, Overvad K, Jakobsen MU. Intake of ruminant trans fatty acids and changes in body weight and waist circumference. Eur J Clin Nutr. 2012 Oct;66(10):1104-9. doi: 10.1038/ejcn.2012.87.
  • Romero-Corral A, Somers VK, Sierra-Johnson J, Korenfeld Y, Boarin S, Korinek J, Jensen MD, Parati G, Lopez-Jimenez F. Normal weight obesity: a risk factor for cardiometabolic dysregulation and cardiovascular mortality. Eur Heart J. 2010 Mar;31(6):737-46.
  • Turpeinen AM, Mutanen M, Aro A, Salminen I, Basu S, Palmquist DL et al. Bioconversion of vaccenic acid to conjugated linoleic acid in humans.Am J Clin Nutr2002;76: 504–510.

Fat Advantage: 61% Lower Rates of Metabolic Syndrome in High Fat, 101% Higher Rates in Low Fat Dairy Lovers

"Got milk" is not the question health conscious supermen and -women should pose. "Got full fat milk, fermented dairy and cheese" is the line to remember (the original image was part of the "Got Milk Campaign")
While diet fads come and go, the advice the wise (not seldom obese or otherwise sick) experts on the boards and panels of our well-meaning governments is calling "dietary recommendations" is about as resistant to reform as the dreaded MSRA strains are to the antibiotics doctors are throwing at you whenever you sneeze. Against that background the recent trend we are seeing with respect to an increase in the recommended amount of dietary protein does almost amount to a quantum leap; a leap with a significant caveat, however. A fat caveat, so to say:
"A healthy diet includes [...] lean meats, poultry, fish, beans and fat-free or low-fat dairy products" (NIH. 2012).
Luckily, you as a SuppVersity reader do not have to rely on the NHI's thwarted interpretations of the latest research they claim to use, when they are "turning discovery into health" (no joke, this is a literal citation from the footer of the NHI website!), but can compare it to my thwarted interpretations of the latest research and cherry picked data ;-)

Cherry pick of the day: Longitudinal large scale study on dairy intake and metabolic health

 For Today, this means that you get to enjoy the latest results of a large scale observational study from the University of Sydney that's based on datasets from the Blue Mountains Eye Study (BMES) a population-based cohort study of common eye diseases and other health conditions in residents aged 49 years and over in the Blue Mountains area, west of Sydney. A longitudinal study the baseline information was obtained in 1992/1994 from  and complemented by follow-up ten years later.

The data sets included food frequency questionnaires, as well as anthropometric and biochemical assessments all of which were included in the present analysis of the association betweenn dairy consumption with the ten-year incidence of Metabolic syndrome (MetSyn) and type 2 diabetes. What's so special about this dataset, is that the food questionnaires were actually detailed enough to assess the effects of full- and low-fat dairy, separately - a very important advantage, as a cursory glance at the data in figure 1 reveals.
Figure 1: Odds ratios (95% confidence intervals) of incident metabolic syndrome according to quartiles of reduced/low fat,
regular fat and total dairy product intake (data based on Louie. 2012; adjustments for age and sex (basic model), smoking status, physical activity (metabolic equivalents), dietary glycemic load, fibre from vegetables, total energy intake and family history of type 2 diabetes (model 1) and calcium (model 2))
While the standard analysis for total dairy consumption (figure 1, left) yielded neither conclusive, nor statistically significant results (the p-values for the different models can be found in the upper right corner of the respective graphs). The categorization into low- and high fat dairy and the adjustments for age and sex (basic model), smoking status, physical activity (metabolic equivalents), dietary glycemic load, fibre from vegetables, total energy intake and family history of type 2 diabetes (model 1) and calcium (model 2) yields very clear and, after adjustment for calcium intake, pretty unflattering result the formulators of the afore mentioned "dietary recommendations" will probably file in their already bristling "statistical outliers"-folder:
  • after adjustment for calcium intake subject in quartiles 2 / 3 / 4 of low-fat dairy are 50% / 145% / 101% more likely to be struck by metabolic syndrome, than those in the lowest quartile of low fat dairy intake (p = 0.043), while
  • subjects in the highest quartile of full-fat dairy intake are - depending on the adjustments made -  48% / 59% / 61% less likely (base model / model 1 / model 2) to suffer frommetabolic syndrome, than those in the lowest quartile of high fat dairy intake (p-values:  0.018 / 0.004 / 0.004)
Yet while the scientists are well aware, that these results stand in stark contrast to the initially cited dietary recommendations, is it not this contrast that surprises them, but rather the fact that a similar significant benefit was not observed for type II diabetes, which is, after all, one of the hallmark features of the rather loosely defined triad of obesity, insulin resistance and cardiovascular disease(s), we usually refer to as 'metabaolic syndrome':
"Due to its higher saturated fat content, regular fat/high fat dairy products were previously believed to increase the risk of type 2 diabetes as a high saturated fat intake is associated with insulin resistance . However, cohort studies and a meta-analysis now suggest otherwise, with higher regular fat/high fat dairy consumption being considered mostly neutral or protective for type 2 diabetes. The results of the present study are consistent with these findings that higher regular fat dairy consumption may be protective of MetSyn and type 2 diabetes. The potential harmful effects of higher saturated fat from regular fat dairy products may have been offset by the protective components of regular fat dairy such as trans-palmitoleate, a fatty acid nearly unique to ruminant foods. Circulating level of trans-palmitoleate was shown to be significantly associated with reduced risk of type 2 diabetes (Q5 vs Q1: 62% reduced risk, p-trend < 0.001). Moreover, the protective effect of trans-palmitoleate may be exerted via the suppression of hepatic fat synthesis, where the latter was strongly associated with insulin resistance." (Louie. 2012; my emphases)
In view of these mechanism, it is all the more surprising that the study at hand and many previous studies didn't find any significant correlations between (regular fat) dairy intake and type II diabetes.

Reduction in metabolic risk, but no effect on type diabetes? Hold on...

Wolverine could be the only face of the "Got Milk" campaign who does not have to care about potential negative health effects of homogenized milk.
And upon a cursory read of the latest literature it does in fact seem as if "null findings" like this, were nothing special. Only recently by Sluijs et al. who had analyzed datasets from a nested case-cohort within 8 European countries of the European Prospective Investigation into Cancer and Nutrition Study (n = 340,234; 3.99 million person-years of follow-up) includind a random subcohort (n = 16,835) and incident diabetes cases (n = 12,403; cf. Slujis. 2012):
"This large prospective study found no association between total dairy product intake and diabetes risk. An inverse association of cheese intake and combined fermented dairy product intake with diabetes is suggested, which merits further study." (Sluijs. 2012)
If we do yet take a closer look at the actual results the actually not so surprising truth is that there was a statistically significant inverse association with diabetes for cheese (p = 0.01) and fermented dairy (p = 0.02).

An association that suggests a 12% reduction in diabetes risk in those study participants who consumed the most cheese and fermented dairy (cheese, yogurt, and thick fermented milk)

And since you all know your real foods, I guess I don't have to tell you that despite the fact that there are low fat varieties of cheese yogurts and other fermented milk products, 90% of them contain way more than the 1.5% let alone 0.1% fat the allegedly healthy low fat "milk" is boasting of. Mere coincidence? I don't think so. Reason to assume that low-fat milk will make you sick? No, but certainly not an argument to avoid the full-fat variety simply because it contains fat (which is the only argument the average dietitian has to favor low- over full-fat dairy products).

Mutant Milk!? New Research Fuels the Flames on Hushed Up Concerns About Ill Health Effects of Homogenized Milk 
Ask Dr. Andro: Are Colostrum and Milk Products in General Healthy Muscle Builders, a Waste of Money or Toxic Waste?
All about milk: Browse past news and articles at the SuppVersity
^ Suggested reads
Additional recent dairy science:Similar beneficial findings for all-cause mortality and fermented dairy (yet inconclusive results for CVD and diabetes) come from the recently published Whitehall II study (4526 subjects,72 % men, mean age 56 years; Soedamah-Muthu. 2012) and for dairy intake during adolescents and diabetes (-38% risk reduction for 2 servings per day or more) from a reanalysis of somewhat questionable data (who remembers exactly how much dairy he had during his adolescence?) from the Nurses' Health Study II cohort that comprises 37,038 women who completed a food-frequency questionnaire about their diet during high school were followed from the time of return of the questionnaire in 1998-2005 (Malik. 2012).


References:
  • Louie JC, Flood VM, Rangan AM, Burlutsky G, Gill TP, Gopinath B, Mitchell P. Higher regular fat dairy consumption is associated with lower incidence of metabolic syndrome but not type 2 diabetes. Nutr Metab Cardiovasc Dis. 2012 Sep 26. pii: S0939-4753(12)00193-7. 
  • Malik VS, Sun Q, van Dam RM, Rimm EB, Willett WC, Rosner B, Hu FB. Adolescent dairy product consumption and risk of type 2 diabetes in middle-aged women. Am J Clin Nutr. 2011 Sep;94(3):854-61.
  • NIH. Health in the News: Love Your Heart. February 2012. < http://newsinhealth.nih.gov/issue/feb2012/feature1 > retreived Oct 02, 2012.
  • Soedamah-Muthu SS, Masset G, Verberne L, Geleijnse JM, Brunner EJ. Consumption of dairy products and associations with incident diabetes, CHD and mortality in the Whitehall II study. Br J Nutr. 2012 Jun 7:1-9.
  • Sluijs I, Forouhi NG, Beulens JW, van der Schouw YT, Agnoli C, Arriola L, Balkau B, Barricarte A, Boeing H, Bueno-de-Mesquita HB, Clavel-Chapelon F, Crowe FL, de Lauzon-Guillain B, Drogan D, Franks PW, Gavrila D, Gonzalez C, Halkjaer J, Kaaks R, Moskal A, Nilsson P, Overvad K, Palli D, Panico S, Quirós JR, Ricceri F, Rinaldi S, Rolandsson O, Sacerdote C, Sánchez MJ, Slimani N, Spijkerman AM, Teucher B, Tjonneland A, Tormo MJ, Tumino R, van der A DL, Sharp SJ, Langenberg C, Feskens EJ, Riboli E, Wareham NJ; InterAct Consortium. The amount and type of dairy product intake and incident type 2 diabetes: results from the EPIC-InterAct Study. Am J Clin Nutr. 2012 Aug;96(2):382-90.

Coffee - 3 Cups Per Day Keep Insulin at Bay: You Better Start Today if You Want to Retain Your Insulin Sensitivity, and Stay Cancer & CVD Free Beyond Your Own Centennial!

I am not entirely sure how often I have used the sentence "consistency is key", here at the SuppVersity, but there is no way I don't reiterate it in the context of the never-ending debate over the pros and cons of habitual coffee drinking, once again. While much of the experimental evidence would suggest that coffee, or to be precise, caffeine the major methylxanthine in the brown brew is a bad sympathetic nervous system activator that stresses your body and will deteriorate your glucose and fat metabolism, the majority of the epidemiological evidence points into the exact opposite direction.

A paper that's going to be published in the next issue of AGE the Journal of the American Aging Association could however help not just to bridge the widening gap between the ever-increasing number of epidemiological studies showing between moderate caffeine consumption and metabolic, cardiovascular, neurological, and cellular health (see list at the end of this post) and the conflicting evidence from experiments that investigate the acute response to caffeine ingestion in both caffeine-naive individuals and habitual caffeine consumers.

Consistent caffeine consumption is the key to "chronic health" ;-)

I am pretty sure this study won't close the lit on the never-ending debate about the pros and cons of caffeine consumption - mostly because it's a rodent study, but also in view of the fact that there is no definite border between "habitual consumption" and "chronic abuse", when it comes to a substance the stimulating side-effects of which can keep you functioning (and training!), when your body would otherwise long have called a halt.

Against that background it is important to realize that the rodents in the study at hand were leading a happy, more or less stress-free life. They consumed what you would consider a "healthy" diet for a rodent and had free access to a wheel, the average male and female Wistar who has neither television, nor Internet or a PlayStation in his or her cage, will actually make good use of.
Figure 1: Body weight (in g), visceral fat weight (in g/kg body weight) and skeletal muscle glucose transporter 4 expression (GLUT4 activity relative to glucose breakdown) over the course of 24 months with or without the provision of the human equivalent of caffeine of roughly 3 cups of coffee in the drinking water (data based on Guarino. 2012)
Accordingly, you should not wonder, let alone be disappointed that there is no magical "fat destruction" such as the one we've seen about a months ago in the CLA-study (see "CLA Destroys Body Fat: Effect Borders Pathological Lipodystrophy!"). Remember: Consistency is key! And some of the benefits of today's coffee may not show before you are in your late 70s... but let's get back to the results data from figure 1 and their implications for your current and future health:
Additional observations:
  • the decrease in visceral fat mass was not due exclusively to increased lipolysis
  • the increase in insulin sensitivity induced by caffeine was not attributable to weight loss, increased NO production, caffeine-mediated antioxidant effects, decreased cortisol levels, or decreased SNS activity
  • caffeine intake did not modify blood pressure, endogenous NO production, or antioxidant capacity in aged animals 
  • caffeine administration restored Glut4 expression in the elderly group, but it was not able to increase Glut4 expression above amaximal level in the 12Mgroup
  • the rodents were kept on a normal diet, a healthy body weight is thus only a sign of overall metabolic health (remember: skinnier does not equal healthier!),
  • the 42% lower visceral fat levels in what would be middle aged rodents (12 months) is one of the most significant predictors of healthy aging (optimal brain and metabolic health + no cancer), and
  • the maintenance of skeletal muscle GLUT4 expression is of fundamental importance to ward of those increasingly common "age-related" diseases of which we already know that they are at least precipitated by insulin resistance and high glucose levels, such as Alzheimer's and "regular" dementia (e.g. Rönnemaa. 2008; Accardi. 2012; Williamson. 2012)
Against the background of the previously mentioned conflict between experimental (caffeine induces stress and thwarts glucose and fatty acid metabolism) and epidemiological (caffeine correlates with metabolic health) evidence it is also important to mention that these beneficial effects were not negated by the dreaded stress-induced increases in non-esterified fatty acids (NEFA), which is the most commonly heard argument of the opponents of caffeine / coffee consumption. On the contrary, the ...
"[...] increase in insulin sensitivity induced by caffeine was not attributable to weight loss, increased NO production, caffeine-mediated antioxidant effects, decreased cortisol levels, or decreased SNS activity [so that caffeine effectively] restored [otherwise elevated] circulating NEFA in aged animals to values observed in young 3 M control rats." (Guarino. 2012)
In the absence of increased NEFA levels, an increased sympathetic tone (=higher catecholamine and cortisol levels) and in the presence of optimal GLUT-4 expression and low visceral fat levels in the young and middle aged rodents, there is actually no reason why we would see any of the putative negative effects on glucose metabolism of about which you will probably have read and heard numerous times in the laypress.
Figure 2: Glucose clearance during ITT (in % glucose/min), basal plasma and insulin levels (in mM) over the course of 24 months (basically one rodent lifespan) with or without the provision of the human equivalent of caffeine of roughly 3 cups of coffee in the drinking water (data based on Guarino. 2012)
And, as a matter of fact, the data in figure 2 does confirm just that: The chronic administration of caffeine at a dosage of which the researchers state, that it will generate plasma caffeine levels "comparable to those in moderate to low consumers of caffeinated beverages" (Guarino. 2012), i.e. people who drink about 3 cups of the delicious brew per day (300-500mg caffeine; Gasio. 2002), is probably one of the most delicious and convenient ways to ward off age-related declines in glucose tolerance... this does yet not mean that drinking coffee (let alone Coke or energy drinks) could make up for a sedentary lifestyle and (ab-)using caffeine pills and stims to keep functioning will probably even have the opposite effects.

Glucose management figures everywhere and so does coffee!

Did you know that the data from a recently published trial suggests that "14-day caffeine supplementation [at 5mg/kg body weight] can probably decrease exercise-induced inflammatory response (CRP elevation and Leukocytosis) following 30 min downhill running in male non-athletes" (Jafari. 2012)? That's actually pretty intruiging, as it shows that the already mentioned differences between the chronic and acute effects of trimethylxanthie aka caffeine are not restricted to its effect on overall and metabolic health, especially as, caffeine has hitherto not exactly been known as a an ergogenic the effects of which build up over time... in fact, rather the opposite is usually assumed, although the evidence for the decline of the ergogenic (not the stimulant!) effects of caffeine are still inconclusive.
In view of the major role of glucose management in all sorts of the metabolic, endocrine and neurcrine diseases, it is thus no wonder that study after study finds beneficial effects of moderate caffeine consumption on...
  • risk of heart failure (Mostofsky. 2012)
  • perceptibility to arrhythmia (Klatsky. 2011)
  • venous thromboembolism (Enga. 2011)
  • general cardiovascular disease (Bøhn. 2012)
  • dementia & Parkison's (Cao. 2012; Campdelacreu. 2012)
  • diabesity (Hjellvik. 2011; Matsuura. 2012)
  • pancreatic cancer (Dong. 2011), as well as 
  • bladder, breast, buccal and pharyngeal cancer (Yu. 2011) 
  • colorectal, endometrial, esophageal cancer (Yu. 2011) 
  • hepatocellular, leukemic, and prostate cancers (Yu. 2011)
And though, I could certainly extend this list by a dozen or so references for each item and half a dozen additional items, I guess I'd rather end today's blogpost on the note that coffee (and tea) contain way more than just caffeine. I would therefore suggest you don't rely on caffeine alone, but rather grab yourself an old-fashioned black cup of coffee (ad some creme if you can't stand it black, or coconut oil, if you like that better) and the time it takes to savor the aroma and taste of it... I can guarantee: That will exponentiation its health effects and will allow you to catch up on the 5 minutes you may have lost in no time.

References:
  • Accardi G, Caruso C, Colonna-Romano G, Camarda C, Monastero R, Candore G. Can Alzheimer disease be a form of type 3 diabetes? Rejuvenation Res. 2012 Apr;15(2):217-21.
  • Bøhn SK, Ward NC, Hodgson JM, Croft KD. Effects of tea and coffee on cardiovascular disease risk. Food Funct. 2012 Jun;3(6):575-91.
  • Campdelacreu J. Parkinson disease and Alzheimer disease: environmental risk factors. Neurologia. 2012 Jun 13.
  • Cao C, Loewenstein DA, Lin X, Zhang C, Wang L, Duara R, Wu Y, Giannini A, Bai G, Cai J, Greig M, Schofield E, Ashok R, Small B, Potter H, Arendash GW. High Blood caffeine levels in MCI linked to lack of progression to dementia. J Alzheimers Dis. 2012;30(3):559-72.
  • Dong J, Zou J, Yu XF. Coffee drinking and pancreatic cancer risk: a meta-analysis of cohort studies. World J Gastroenterol. 2011 Mar 7;17(9):1204-10.
  • Enga KF, Braekkan SK, Hansen-Krone IJ, Wilsgaard T, Hansen JB. Coffee consumption and the risk of venous thromboembolism: the Tromsø study. J Thromb Haemost. 2011 Jul;9(7):1334-9.
  • Gasior M, Jaszyna M,Munzar P,Witkin JM, Goldberg SR. Caffeine potentiates the discriminative-stimulus effects of nicotine in rats. Psychopharmacology (Berl). 2002; 162:385–395 
  • Guarino MP, Ribeiro MJ, Sacramento JF, Conde SV. Chronic caffeine intake reverses age-induced insulin resistance in the rat: effect on skeletal muscle Glut4 transporters and AMPK activity. Age (Dordr). 2012 Sep 14.
  • Hjellvik V, Tverdal A, Strøm H. Boiled coffee intake and subsequent risk for type 2 diabetes. Epidemiology. 2011 May;22(3):418-21.
  • Jafari A, Kherad N, Melekirad AA. Effect of short-term caffeine supplementation on downhill running induced inflammatory response in non-athletes. Journal of Cell. Winter 2012; 2(4):377-385
  • Klatsky AL, Hasan AS, Armstrong MA, Udaltsova N, Morton C. Coffee, caffeine, and risk of hospitalization for arrhythmias. Perm J. 2011 Summer;15(3):19-25.
  • Matsuura H, Mure K, Nishio N, Kitano N, Nagai N, Takeshita T. Relationship between coffee consumption and prevalence of metabolic syndrome among Japanese civil servants. J Epidemiol. 2012;22(2):160-6.
  • Mostofsky E, Rice MS, Levitan EB, Mittleman MA. Habitual coffee consumption and risk of heart failure: a dose-response meta-analysis. Circ Heart Fail. 2012 Jul 1;5(4):401-5. Epub 2012 Jun 26.
  • Nature.com Reviews. Heart failure: Moderate coffee consumption linked with reduced risk of HF. Nat Rev Cardiol. 2012 Jul 17;9(9):492.
  • Rönnemaa E, Zethelius B, Sundelöf J, Sundström J, Degerman-Gunnarsson M, Berne C, Lannfelt L, Kilander L. Impaired insulin secretion increases the risk of Alzheimer disease. Neurology. 2008 Sep 30;71(14):1065-71.
  • Williamson R, McNeilly A, Sutherland C. Insulin resistance in the brain: An old-age or new-age problem? Biochem Pharmacol. 2012 Sep 15;84(6):737-45.
  • Yu X, Bao Z, Zou J, Dong J. Coffee consumption and risk of cancers: a meta-analysis of cohort studies. BMC Cancer. 2011 Mar 15;11:96.

Insulin, A Major Nutritional Modulator of the Circadian Clock!? Would a High Carb Dinner Qualify as Anti-Jet-Lag Meal? Plus: Exercise Before or After Breakfast?

Food cues - and as it seems the insulin response - are important "Zeitgeber" for the circadian clock.
As a SuppVersity reader you are well familiar with the notion that food not only nourishes the body but also affects its internal biological clock. The latter is the central controller of all cyclic processes in your body and influences almost all aspects of daily human behavior and biology.

Researchers from the Jamaguchi and the Saga University in Japan are now reporting in the latest issue of the Cell Press journal Cell Reports that they have gained new insights into how adjusting the clock through dietary manipulation may help patients with various conditions.
You can learn more about the circadian rhythm at the SuppVersity

Sunlight, Bluelight, Backlight and Your Clock

Sunlight a La Carte: "Hack" Your Rhythm
Breaking the Fast to Synchronize the Clock

Fasting (Re-)Sets the Peripheral Clock

Vitamin A & Caffeine Set the Clock

Pre-Workout Supps Could Ruin Your Sleep
And the tool Sato et al. are using is one you are all familiar with: insulin - insulin that is produced by your pancreas, not just in response to carbohydrates, but also in response to the ingestion of larg(er) quantities of fast digesting protein (see "Whey More Insulinogenic Than White Bread" | read more).

The notion that feeding / fasting can (re-)set the internal clock is not exactly new. The idea that it is insulin that mediates this process, on the other hand, is as new as it is logical: If it is insulin that synchronizes the central and peripheral clock, it is no wonder that the latter are always off in patients with type II diabetes!
Figure 1: No real shift in the lung.
Figure 2: A significant shift of Per2-Clock expression in the white adipose tissue after feeding (arrow | x-axes in h) of confirms: Insulin controls clocks related to energy storage / usage (Sato. 2014)
Chronic desynchronization between physiological and environmental rhythms not only decreases physiological performance but also carries a significant risk of diverse disorders such as diabetes, cardiovascular diseases, sleep disorders, and cancer," says Dr. Makoto Akashi, of Yamaguchi University, in Japan. -from the press release
The circadian clock involves two major pathways. The first, which responds to light, has been well characterized. The second, which responds to food, is less understood. The results Saito, Akashi et al. present in their latest paper do thus provide a new piece to a hitherto elusive puzzle:
"Insulin-mediated phase adjustment of the clock in feeding-relevant tissues may enable the synchronization between mealtime and tissue function, leading to effective digestion and absorption. In short, insulin may help the stomach clock synchronize with mealtime."
This would imply that an anti-jet-leg dinner should be high in carbs, because it would advance the circadian clock. Quite an interesting feat, because it would explain why people tend to try to fix their social jet lag (not going to bed early enough) with sugary junkfood.
Boking: Every endurance athletes knows and fears it, so wouldn't just that happen when you do your cardio on empty in the morning? And what about the effects on your brain power?
Only another piece to the puzzle: I am pretty sure that the insulin connection is not the last revelation with respect to the complex regulatory factors that are involved in the control of our circadian rhythm. That being said, exercise is another, commonly overlooked regulator of the circadian clock. In a recent paper in J Phys Fitness Sports Med, scientists from the Waseda University in Japan report that "[e]xercise before breakfast increases beta-oxidation and reduces serum TG levels, while exercise after breakfast decreases appetite and reduces serum TG." (Shibatata. 2014). Moreover, exercise performed at midnight produced phase-delay shifts, which would allow you to stay up longer, while performed similar physical activites in the early evening or late day will induce phase-advance shifts, that will allow you to go to bed at 8pm instead of 10pm...

I guess you will realize that even though Saito, Akahsi et al. may be right and insulin is an important regulator of the circadian clock, it stands out of question that it is only one out of many factors that influence the synchronicity between internal (light, sleep) and peripheral (food, exercise, etc.) clock | Comment on Facebook!
References:
  • Sato et al. "The Role of the Endocrine System in Feeding-Induced Tissue-Specific Circadian Entrainment". Cell Reports (2014). http://dx.doi.org/10.1016/j.celrep.2014.06.015
  • Shibata, Shigenobu, and Yu Tahara. "Circadian rhythm and exercise." The Journal of Physical Fitness and Sports Medicine 3.1 (2014): 65-72.

Leucine + Resveratrol - Synergistic Sirtuin Boosters: +118% Fatty Acid Oxidation, 60% Increase In Muscular Glucose Uptake, -30% Visceral Fat & More - To Good to be True?

Image 1: Can you really team up leucine (or HMB) and resveratrol to make tired mitochondria get a move on? NuSirt Sciences says "YES!" And in the dish and rodents it's actually already working.
What happens if you marry a well-known AMPK promoter and exercise mimetic, with an even more prominent exercise adjuvant and nutritional mTOR booster? Will they neutralize each other? Think about it.... ok, now gimme your answer: What happens if you put resveratrol and leucine together? At first it does not really make sense, does it? Right, it doesn't, at least not unless you follow the same train of thought, the researchers from NuSirt Sciences. NuSirt? That rings a bell, hah? Yeah those were the guys who did a study on their 250mg leucine + 30mg vitamin B6 proprietary blend NuFit (see "Testosterone - 12% Drop /W 75g Glucose? Fat Loss - Adzuki, Leucine + B6 or HiMaize & More") and actually, the leucine + resveratrol combination is sort of a spin-off of this initial research.

If you put Sirt1 & Sirt1 together, it suddenly makes sense!

In their latest study (and you bet a future product!) Bruckbauer et al. build on their previous research on the agonistic effects HMB, alpha-KIC or leucine have on skeletal muscle Sirt-1 activity (Bruckbauer. 2011) and rationalize that it seems legit to combine one Sirtuin portein promoter with another one in order to achieve an even more pronounced effect - makes sense, right? Resveratrol the proven AMPK-promoter and igniter of the longevity, gene transcription, cell survival and apoptosis regulating Sir2 proteins (=sirtuins) and leucine the mTOR promoting and, as of late, proven Sirt1 agonist, they could actually form a synergistic duo for fat oxidation, glucose management, the reduction of oxidative stress and inflammation and even longevity!
Figure 1: Effects on sirtuin & AMPK expression in muscle and fat cells upon incubation with leucine, HMB and resveratrol and the respective combinations (left) and effects fatty acid oxidation in isolated rat skeletal muscle upon incubation in low and high glucose conditions (data based on Bruckbauer. 2012)
Now, aside from Sirt1, which is mainly expressed in the nucleus of a cell, another one of the Sir2 proteins, Sirt3, which is expressed predominantly in the mitochondria has as of late gathered quite some attention, as mitochondrial dys- or malfunction is one, if not the common denominator of many of the pathological features of the metabolic and neuro-endocrine ailments the Western diabesity society is suffering from: insulin resistance, type II diabetes, Alzheimer's , you name them! No wonder the NuSirt guys (and girls) are striving to find a marketable way to set them both in full gear and if you take a closer look at the data in figure 1 their initially counter-intuitive approach to bath muscle and fat cells in resveratrol  + HMB / leucine solutions yields impressive results:
  • resveratrol, leucine and HMB, alone, exerted only weak independent effects on Sirt1, Sirt 3 and AMPK
  • resveratrol and leucine or HMB, combined, yielded Sirt1 and Sirt3 activity increases in the ~50% range (p < 0.05) and AMPK increases of +42% and +55% (p < 0.03); particularly noteworthy are the ~125-175% increases (p < 0.02) muscle cells (remember: Sirt3 is expressed in the mitochondria!)
  • the ensuing increases in fatty acid oxidation in incubated muscle cells reached statistical significance in the presence of low (5 mM) glucose levels, only, when and 5 µM HMB or  0.5 mM leucine were co-incubated with 200 nM (~18%; p < 0.05), in the high glucose condition, however, all treatments broad about significant increases in fatty acid oxidation, of which those in the leucine- and HMB-resveratrol combination treatments were the most pronounced (118% and 91% stimulation, respectively; p < 0.005)
Especially the last finding, i.e. the increase in fatty acid oxidation in an in-vitro condition that resembles the hyperglycemic state the average type II diabetic who is not popping tons of metformin and/or injecting insulin is constantly in, makes these results particularly interesting, as it appears as if a "non-pharmacological" (what by the way is "pharmacological" and what isn't?) solution to the diabesity problem could already be hidden on the shelves of your GNC right next door (I assume they carry leucine and resveratrol products ;-)!

Outside of the box... ahh, I mean, ... the petri dish!

In view of the fact that 75% of the in-vitro high performers suck in the rodent model already and of those another 75% don't work in human trials you will be pleased to hear that NuScirt Sciences' resveratrol + leucine / HMB combination has already overcome the first of these hurdles: At least in DIO (diet-induced-obese) rodents who on a 6-week high fat diet regimen, the combination works.
Figure 2: Weight gain, visceral adipose volume, PET measured palmitate uptake, respiratory rate (lower levels = higher relative fat oxidation), heat production relative to body weight, food intake; all value expressed relative to DIO mice who were maintained on an unsupplemented control diet (data based on Bruckbauer. 2012)
Now, it's not as if the rodents would have made it to the Mr Olympia stage, but if you take a closer look at the pattern that's emerging here, it's quite clear that the sirtuin booster does its job in this rodent model. Aside from its ameliorative effect on weight gain, the combination of resveratrol and leucine, led to statistically significant improvements in glucose management and improvements in inflammatory markers (including the anti-inflammatory adipokine adiponectin, see figure 2).
Figure 2: Glucose, insulin and HOMA IR levels, muscular glucose uptake (left), C-reactive protein , IL-6, MCP-1 and adiponectin (right) ; all value expressed relative to DIO mice who were maintained on an unsupplemented control diet (data based on Bruckbauer. 2012)
Most importantly, however it effectively cut through the exuberant amount of visceral adipose tissue (>30% reduction), ramped up the palmitate (fatty acid) uptake, oxidation and heat production (=thermogenesis). Despite all these metabolic improvements which took place in the absence of a simple reduction in food intake, there are still a couple of things left to be desired:
What are the human equivalent doses, here? Since I know you would be asking I did the math for you and you will be pleasantly surprised (HED for 80kg humans)
  • 12.5mg resv. = 9mg
  • 225mg resv. = 136mg
  • 2g HMB = 1.1-1.4g
  • 10g HMB = 7.2g
  • 24g leucine = 14.3g
I am well aware that it must look as if I had the typical poor arithmetic abilities of the average physicist who has totally forgotten how to calculate using figures instead of letters, but the reason for the discrepancies is that I calculated the exact HEDs based on body weight and food intake for each of the groups.
  1. Supplementation with the respective human equivalent doses should yield the same astonishing results in humans as it did in the diet-induced obese mice.
  2. The protocol should have effects not just in morbidly obese diabetic human beings, but also in overweight and ideally even lean individuals.
  3. The supp must work if you don't put it into the chow, but pop it in separate doses (e.g. 3x/day) as a capsule or tablet.
The good news however is that if 1-3 apply, you could start benefiting from this "super supplement" right now! After all, the resveratrol dose of 12.5mg per kilogram of chow (the mice in the study did not consume more than max. 4g(!) per day) is so low that the 10g package I just saw for 20$ over at the webshop of a major bulk supplier would last you literally forever ...

Unfortunately, this is exactly why I don't believe that LeuResSirt, or whatever other stupid name the final product will be given, is going to work - I mean, come on, you can't tell me that there are not already people out there who get 15-20g of leucine everyday and pop resveratrol in 100x the necessary dose of 8-9mg everyday!? And did they turn into a beast, become fast-food resistant or lose fat magically? What? Yeah... that must be Phil Heath secret, right... how come I did not realize that before? ;-)

Bottom line: Regardless of the probably justified skepticism, I will still keep you posted on whether or not NuSirt knocks out another incredible (in the literal sense) human study like the one on NuFit (see "Testosterone - 12% Drop /W 75g Glucose? Fat Loss - Adzuki, Leucine + B6 or HiMaize & More"). So stay tuned, you all know that no supplement will ever more ergogenic than your daily dose of SuppVersity news!

References:
  • Bruckbauer A, Zemel MB. Effects of dairy consumption on SIRT1 and mitochondrial biogenesis in adipocytes and muscle cells. Nutr Metab (Lond). 2011 Dec 20;8:91.
  • Bruckbauer A, Zemel MB, Thorpe T, Akula MR, Stuckey AC, Osborne D, Martin EB, Kennel S, Wall JS. Synergistic effects of leucine and resveratrol on insulin sensitivity and fat metabolism in adipocytes and mice. Nutr Metab (Lond). 2012 Aug 22;9(1):77.

Is There A Simple Marker on Your Standard Labs That Can Tell You Whether You're at High Risk of Heart Disease & Insulin Resistance? If So, How High / Low Should It Be?

Apples are more likely to be insulin resistant than pears... no, we are not talking about the fruits and neither about their effects on insulin resistance, but rather about the areas where you carry most of your body fat. If it's on the buttocks and thighs, your risk of being insulin resistant is much lower than if the lion's share of your passive energy store resides right on your abs.
If you've read the headline of today's SuppVersity article you are already in the know what this is going to be all about. I am yet not sure, whether you actually understand why doing a study like this makes sense... don't worry if you don't I have to admit I had to thing about it for quite some time, until looking at the various measures until it dawned on me that the main advantage is - you guessed it - of monetary nature!

I mean, if you could tell simply by looking at the standard labtests, most of which do include both triglycerides and HDL levels, you could save a lot of money on HOMA-IR or QUICKI tests and still be certain you suffer or don't suffer from insulin resistance and concomitantly increased cardiovascular disease risk.

Now the $64,000 question is: "Were Miguel Murguía-Romero et al. able to save your insurance company a lot of money, or not?"

The truth about cholesterol and heart disease...

... turned out to be more complex than the "pioneers" believed and complex "truths" have the nasty tendency to be self-contradictory and difficult to understand -- too difficult, in fact, to make it to the mainstream media and as it turned out obviously even too difficult for the average general practitioner, who is still easily convinced by the pharma reps that it was "best practice" to prescribe a statin and send the patient, who would be "unwilling and unable to change his dietary habits and increase his amount of physical activity, anyway" home with a script and patient information full of known side-effects most of the patients like to ignore.
Table 1: Talking about "metabolic syndrome" (MetS) what are the criteria to diagnose MetS? (Grundy. 2004)
That being said, the most prominent of the currently heralded alternative indicators of increased risks of cardiovascular disease are...
  • a high level of low-density lipoprotein (LDL),
  • a low level of high density lipoprotein (HDL),
  • exuberant amounts of triglycerides (TRIGS),
... as well as all sorts of combination of the the two, respectively three bad guys (TC, TRIG, LDL)  and the one good guy (HDL). Research has also suggested that pre-existing co-morbidities like diabetes will increase the significance of the predictive effects of high triglycerides to high-density lipoprotein (TRIG/HDL) total cholesterol to high-density lipoprotein (TC/LDL), and LDL to high-density lipoprotein (LDL/HDL) ratios.

With their recently conducted experiment, the scientists from the Stanford University Medical School did now try to elucidate whether the triglyceride / HDL ratio, which has been emerging in trials with old(er) individuals as one of the best markers of cardiovascular disease, would predict the CVD risk in 2244 healthy college students  (17-24  years  old) of Mexican Mestizo ancestry  (1545 women and 699 men) and be able to identify younger individuals that are not merely at high risk of heart disease, but in whom this increased risk is direct consequence of being insulin resistant, as well.
Figure 1: Prevalence of insulin resistance ("objectively" confirmed by HOMA-IR data) as identified by the TG/HDL-C ratio or the criteria for "mebabolic syndrome" listed in table 1 (Murguía-Romero. 2013)
If you take a look at the data in figure 1 you can see that the "kill two birds with one stone"-, or rather "determine two medical problems with one parameter"-method the scientists wanted to establish is not exactly reliable. In fact the, chance of identifying people who had overtly high HOMA-IR values (=were effectively insulin resistant) just by the fact that their TRIG/HDL ratios were >3.5 for men and >2.5 for women is only 50/50.

A closer statistical analysis did still reveal a slightly higher sensitivity for the TRIG/HDL ratio (53% / 55% in women / men) than for the criteria catalog that's used to "diagnose" metabolic syndrome (see table 1), which ended up at a meager sensitivity of 36% for women and 46% for men. 

So where should your TRIG / HDL ratio be then?

In view of the results presented in the study at hand, the triglyceride-to-HDL ratio (TRIG / HDL) although it may not qualify as a diagnostic tool, is is a good indicator that there is something metabolically off. If that's your TRIG / HDL ratio that looks bad. Based on the figures in the study at hand this means:
  • Your ratio of triglycerides to HDL-C should be < 3.5 if you are a man, or 
  • Your ratio of triglycerides to HDL-C should be < 2.5 if you are a woman
If that'S not the case, this alone should be reason enough to investigate whether and how insulin resistant you actually are, what your real heart disease risk is like and what the underlying reasons of your potential health problems could be. You could start out by doing a glucose tolerance test and/or by tracking your glucose levels with a glucometer, for example, to gain some certainty with respect to your current insulin sensitivity. On the cholesterol side of things, however, a particle size analysis may be the next thing on your list (learn why particle size matters).

And don't forget that for most of the health-conscious victims of CVD, stress, not bad eating habits, or a lack of exercise, is the main problem - and that goes for both psychological and physiological stress (including overtraining; learn more).

Bottom line:
Suggested Read: "Eat Whole Eggs All Day and Throw Your Statins Away? 375x Increased Dietary Cholesterol Intake From Eggs Reduces Visceral Fat & Promotes Healthy Cholesterol Metabolism" - For most people eggs boost, not lower HDL and they are certainly not the reason for the ever increasing heart disease risk (learn more)
In view of the fact that the majority of general practictioners is not going to run HOMA-IR or QUICKI tests on their patients on a regular basis, this ratio is certainly one of the best indicators you will find on your standard labs - and what's most appealing: It's better than the set of criteria for "MetSyn" (see table 1), which would, for example, per se overlook all the skinny fats out there.

In fact, the main message associated with the low sensitivity of the "MetSyn" criteria as a benchmark for insulin resistance, may well be that the mere absence of "above normal" levels for abdominal circumference, blood pressure and even blood glucose are not reliable criteria to determine, whether you are insulin resistant, or not. I'd say this is a message with public importance, especially for the skinny fats, who may well be the 15% and 13% of young men and women in the "no metabolic syndrome, but still insulin resistant"-group in the study at hand (see figure 1).

References:
  • Grundy SM, Brewer HB Jr, Cleeman JI, Smith SC Jr, Lenfant C; American Heart Association; National Heart, Lung, and Blood Institute. Definition of metabolic syndrome: Report of the National Heart, Lung, and Blood Institute/American Heart Association conference on scientific issues related to definition. Circulation. 2004 Jan 27;109(3):433-8.
  • Murguía-Romero M, Jiménez-Flores JR, Sigrist-Flores SC, Espinoza-Camacho MA, Jiménez-Morales M, Piña E, Méndez-Cruz AR, Villalobos-Molina R, Reaven RM. Plasma triglyceride/high-density lipoprotein cholesterol ratio, insulin resistance, and cardio-metabolic risk in young men and women. Journal of Lipid Research. 2013 [epub ahead of print]